Cool Map: Lincoln's county-by-county map of slave population
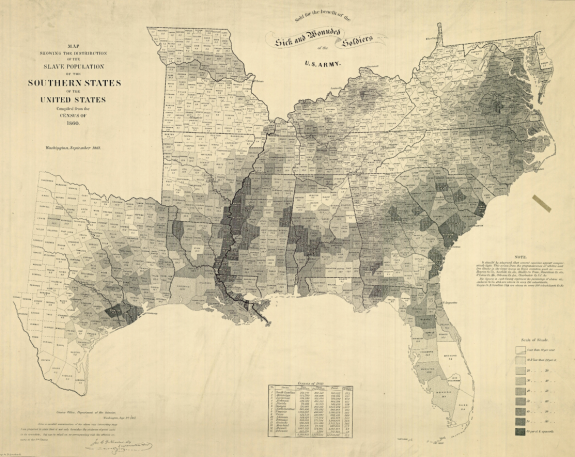
A sobering look at U.S. social conditions, circa 150 years ago. Notice how concentrated slave ownership is in the areas surrounding the major rivers (the Mississippi Delta is one obvious example) and near the largest ports (Houston, the Chesapeake region, Charleston). If you want more detail, there's a full frame version courtesy of the New York Times.


Comments
Post a Comment