Posts

Showing posts with the label The Value of Infoviz

Everybody loves visual information — especially Abraham Lincoln.

Image
Infographics are clearly having a cultural moment. They have become pervasive in newspapers, magazines, blog posts, and viral tweets; they appear on television and in advertising, in political campaigns and at art openings. As a Google search term, “infographic” has increased nearly twenty-fold in the last five years. Yet infographics have been popular, in one form or another, for centuries. The source of their power isn’t computers or the Internet, but the brain’s natural visual intelligence.  Gareth Cook , the editor of Best American Infographics 2013 , has put together a short but true summary of the history of information graphics. (Many of you who see this blog may know most of it already.) His striking lede recounts how much Abraham Lincoln valued his "slave map" (featured in an earlier blog post ). Lincoln's reliance on the shades of gray throughout the Confederacy made an enormous difference in his Civil War decision-making.  Fortunately it's rare that mos

What Not to Do with Infographics, now in handy infographic form

Image
This is an amusing yet cautionary illustration that expresses exactly what I hate about so very many infographics. This approach dumbs down the information under the guise of making you smarter. Hat tip: VizWorld .

Sociological mapping on a grand scale in London

Booth’s Maps are important documents of mass poverty, but by drilling down and giving huge amounts of detail, they do more than analyze it statistically,” said Beverly Cook, curator of social and working history at the Museum of London. “Many writers and artists of the time saw London as a divided city, split between rich and poor, but these maps show its complexities. In many respects, they give a more realistic portrayal of working class life in London than Charles Dickens’s novels. By making something so complicated seem straightforward, Booth’s Poverty Map was also a triumph of information design. It fulfilled one of design’s most useful functions — helping us to make sense of the world — by distilling an avalanche of information into a clear, coherent form. An Early Triumph in Information Design - NYT.com

Some people are tired of all the debt charts.

Alex Pareene, at Salon, for one: I can explain the magnitude of the federal debt pretty easily: The recession caused revenue to plummet, and tax rates have been very low for years. Plus wars. But I explained that with words. Who reads words? No one, unless those words have lines next to them, or colored bars. America's Deficit Chart Surplus -- Salon

US debt charts of note

Image
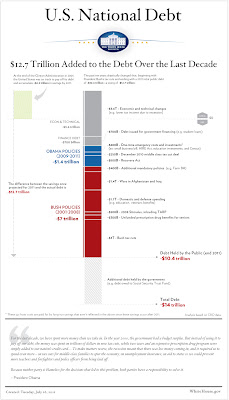
On Sunday, July 24, the New York Times ran a chart illustrating the fiscal results of national policy. Given the fierceness of the ongoing debt-ceiling debate, the chart got picked up and disseminated through the web, and with good reason: It's clear, it's straightforward, and it communicates something very important. (By the way, I have it on good authority that this was the first instance of color being used on the NYT editorial page.) You can see the chart here . Now, finally, comes the White House with this graphic : The Atlantic 's James Fallows likes it , but I'm less impressed. First of all, from a political point of view, it's a bit late to release this; the chart could/should have focused the congressional debate and the public discourse weeks ago. Secondly, despite the telltale Tufte-style typefaces and additional detail, it's not as intuitively readable as the Times' version. The timeline, such as it is, runs vertically, while the magni

Quality dataviz about quality-of-life issues

Image
To accompany its Better Life Initiative , OECD (the Organization for Economic Co-operation and Development) has put up a handsome, carefully constructed set of interactive data graphics called the Better Life Index : There is more to life than the cold numbers of GDP and economic statistics – this Index allows you to compare well-being across countries, based on 11 topics the OECD has identified as essential, in the areas of material living conditions and quality of life. Each country is represented by a multicolored flower with 11 petals (OK, yes, potentially cheesy). The length of each petal represents the country's score in a given area; the width of the petal indicates the importance the user has assigned to that particular aspect. Drilling down into the details is easy to do; in fact, if you've a mind to do your own visualizations of this info, the underlying index data can be downloaded in spreadsheet format. Kudos to Moritz Stefaner , Jonas Leist and Timm Kekeritz (

Infoviz in 2011: a status report

"I predict that we will see a lot more visualization in journalism. A lot of stories are already about numbers, with language mostly telling readers the conclusions. Simple charts with some interaction can provide a bit more context, and more can be added very easily. I doubt that we'll see a big visual journalism revolution in 2011, mostly because of the lack of accessible and practical tools, but we will see a lot more experimentation. The increasing demand will lead to more journalism-focused services being provided by visualization websites, in particular ones that also provide the analytic capabilities (i.e., not just pretty charts)." -- from " The State of Information Visualization, 2011 ," by UNC Charlotte's Robert Kosara . Emphasis added, as this is exactly What We Do here at Synoptical Charts.

Cool Map: Lincoln's county-by-county map of slave population

Image
A sobering look at U.S. social conditions, circa 150 years ago. Notice how concentrated slave ownership is in the areas surrounding the major rivers (the Mississippi Delta is one obvious example) and near the largest ports (Houston, the Chesapeake region, Charleston). If you want more detail, there's a full frame version  courtesy of the New York Times .

Hans Rosling's 200 Countries, 200 Years, 4 Minutes - The Joy of Stats - BBC Four

Kai Krause is a genius.

Image
Eloquent yet immediately comprehensible. A dead-simple concept that illustrates a great truth. Because it is based on extremely solid data -- geographic size, which is as close to actual fact as we can get -- the result is inarguable. Exemplary.

Mapping stereotypes:
all knowledge is contextual

Image
Designer Yakov Tsvetkov ( alphadesigner ) has a lovely series of maps depicting how various people around the world see their national neighbors. This is the view from the USA. The series conveys a lot about insularity, provinciality, metadata, and the human drive to categorize (based on whatever aspects seem most important to them). Is it shorthand, or is it prejudice, or both? Philosophical issues aside, this amusing series is definitely worth exploring. Bon voyage!

Animated map of Afghan engagements from 2004-2009

Image
See it now. Based on the recent Wikileaks release of military documents , Mike Dewar and Drew Conway created this animated month-by-month infographic showing the number and location of engagements over five years in Afghanistan. Beautiful work and very sobering. Animated Heatmap of WikiLeaks Report Intensity in Afghanistan - Zero Intelligence Agents

Data-driven journalism:
an idea whose time has come

On August 24 in Amsterdam the European Journalism Centre is running a conference called "Data-driven journalism: What is there to learn?" Oh, man. I hope the American journalists are listening in. Because there's a lot to learn, in both senses: 1) what patterns and insights can we get from the data, and 2) how can we better deploy the technology? Infoviz is finally gaining widespread renown as a storytelling technique/analysis tool, and I predict that publications will eventually need to use it if they aim to keep current readers and entice new ones. As a longtime journalist and infoviz evangelist, I've been looking forward to this convergence. It may sound corny, but I believe that when information is depicted clearly and intelligently, the graphical evidence really can help people understand the problems they share and point the way to new solutions. Communication breaks down all around us -- why not use as many effective techniques as possible?

That's not helpful!

Sometimes people think the only purpose of an information graphic is to bust out some cool fonts and intersperse the words with some images that are more entertaining than just a table of numbers. Apparently Phil Gyford has had enough of these pikers. Sometimes it ain't in the way you say it, it's what you've got to say in the first place.

How Americans have done financially since 1940

Image
"Aughts were a lost decade for US economy, workers" - Washington Post

Infographic of the day:
Airborne Terror

Image
"The True Odds of Airborne Terror" chart - Gizmodo

Quoted for truth: the benefits of information visualization

John Sviokla , who blogs for the Harvard Business Review about "Innovation, Strategy, [and] Technology," bears witness: In my work with clients, I've seen three primary benefits of superior graphic representation: Great visualizations are efficient — they let people look at vast quantities of data quickly. Visualizations can help an analyst or a group achieve more insight into the nature of a problem and discover new understanding. A great visualization can help create a shared view of a situation and align folks on needed actions. I couldn't agree more. "Swimming in Data? Three Benefits of Visualization" - HBR Blog Network