Posts

Showing posts with the label NYT

Sociological mapping on a grand scale in London

Booth’s Maps are important documents of mass poverty, but by drilling down and giving huge amounts of detail, they do more than analyze it statistically,” said Beverly Cook, curator of social and working history at the Museum of London. “Many writers and artists of the time saw London as a divided city, split between rich and poor, but these maps show its complexities. In many respects, they give a more realistic portrayal of working class life in London than Charles Dickens’s novels. By making something so complicated seem straightforward, Booth’s Poverty Map was also a triumph of information design. It fulfilled one of design’s most useful functions — helping us to make sense of the world — by distilling an avalanche of information into a clear, coherent form. An Early Triumph in Information Design - NYT.com
US debt charts of note

Image
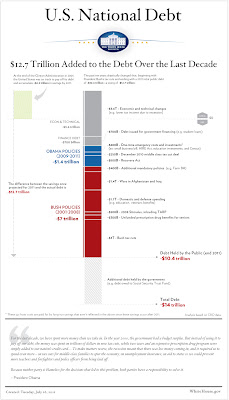
On Sunday, July 24, the New York Times ran a chart illustrating the fiscal results of national policy. Given the fierceness of the ongoing debt-ceiling debate, the chart got picked up and disseminated through the web, and with good reason: It's clear, it's straightforward, and it communicates something very important. (By the way, I have it on good authority that this was the first instance of color being used on the NYT editorial page.) You can see the chart here . Now, finally, comes the White House with this graphic : The Atlantic 's James Fallows likes it , but I'm less impressed. First of all, from a political point of view, it's a bit late to release this; the chart could/should have focused the congressional debate and the public discourse weeks ago. Secondly, despite the telltale Tufte-style typefaces and additional detail, it's not as intuitively readable as the Times' version. The timeline, such as it is, runs vertically, while the magni

Cool Map: Lincoln's county-by-county map of slave population

Image
A sobering look at U.S. social conditions, circa 150 years ago. Notice how concentrated slave ownership is in the areas surrounding the major rivers (the Mississippi Delta is one obvious example) and near the largest ports (Houston, the Chesapeake region, Charleston). If you want more detail, there's a full frame version  courtesy of the New York Times .

Data-driven journalism:
an idea whose time has come

On August 24 in Amsterdam the European Journalism Centre is running a conference called "Data-driven journalism: What is there to learn?" Oh, man. I hope the American journalists are listening in. Because there's a lot to learn, in both senses: 1) what patterns and insights can we get from the data, and 2) how can we better deploy the technology? Infoviz is finally gaining widespread renown as a storytelling technique/analysis tool, and I predict that publications will eventually need to use it if they aim to keep current readers and entice new ones. As a longtime journalist and infoviz evangelist, I've been looking forward to this convergence. It may sound corny, but I believe that when information is depicted clearly and intelligently, the graphical evidence really can help people understand the problems they share and point the way to new solutions. Communication breaks down all around us -- why not use as many effective techniques as possible?

Marijuana math

Image
In a New York Times op-ed back in May, Reason.com editor Nick Gillespie pondered the fiscal consequences of legalizing "victimless" crimes such as prostitution, gambling and drugs: [Here's a way to] help the federal and state governments fill their coffers: Legalize drugs and then tax sales of them. And while we’re at it, welcome all forms of gambling (rather than just the few currently and arbitrarily allowed) and let prostitution go legit too. All of these vices, involving billions of dollars and consenting adults, already take place. They just take place beyond the taxman’s reach... Turning America into a Sin City on a Hill could help President Obama pay for his ambitious plans to overhaul health care and invest in green energy. More taxed vices would certainly lead to significant new revenue streams at every level. Now the folks at nightlife site Sloshspot.com have taken some data from NORML and various U.S. government agencies and created this : Not bad, I think

Infoviz for business: Fast Company
points the way

Michael Cannell asks on the Fast Company blog (formerly mentioned here ): "Is Information Visualization the Next Frontier for Design?" I'm figuring that's a rhetorical question, since the subhed reads: "As design work shifts to infrastructure and problem solving, sexy infographics are part of the new skill set." Of course we at Synoptical Charts couldn't agree more. He goes on to discuss infoviz as a discipline and mentions its many applications and its immense potential: If we're going to live in a world driven by data, the thinking goes, we need a simple means of digesting it all. We are increasingly a visual society, and our understanding of the world is increasingly made possible by this new visual language.... Designers have historically excelled at finding insightful ways of looking at complex problems. Visualization will likely play a prominent role as design evolves beyond the consumer economy (selling $2,000 poufs and other high-end furnis

Infoviz goes steampunk: data artist
Tim Schwartz

Image
San Diego digital artist Tim Schwartz tracked the prevalence of certain words in 158 years of the New York Times and then, rather than create animation or static graphs (too mainstream?), he used that data to power his amusingly retro Command Center (above). Check out those analog gauges and the LED time display! Even the biomorphic shape harks back to a low-tech era. Lovely work, Tim. Playful projects like this give me tremendous hope that soon data visualization will be understood, accepted and even adopted by average folks.

Meta-information: visualizing the news

Image
A headline from the Guardian About a year ago, University of Huddersfield design student Dave Bowker created Designing the News, a six-part series of data graphics depicting one week's worth of information from and about the Guardian . (It earned him a First .) The methods used in each piece focus on a specific goal of presentation, including the ranking of information, categorisation, colour coordination, illustration, graphing of complex data, and relationship tracking. The purpose of the project is to present the news in a way that people wouldn't usually experience it. This is done by attracting the viewers with beautiful graphics, and then holding their attention with a deeper investigation into the information they see everyday. The rundown of images and approaches can be seen here . Of the various formats and approaches, I think Thursday and Saturday are the most successful. Friday , unfortunately, turns into a blur at 20 paces, while I find Wednesday somewhat hard

Critique: NYT unemployment graphics

Image
To illustrate the horrible unemployment numbers announced today ( "employers in the United States have shed about 3.6 million jobs since December 2007" ), the New York Times presents a series of graphics : 1 ) We have a perfectly nice bar chart here: clear, legible, professionally done, all that. This chart tells us two (2) things: what month it is and how many jobs were lost. Surely there is additional info about this two-year stretch that would add depth and meaning (and potentially even yield an epiphany or two!). One suggestion: The story says, "Manufacturers eliminated 207,000 jobs, more than in any year since 1982. The construction industry eliminated 111,000 jobs. And retailers, who were wrapping up their worst holiday shopping season in years, eliminated 45,000 jobs." Segmenting each bar by color to represent the various sectors would show at a glance where the biggest losses were coming from. 2) Again, a perfectly nice fever chart. (I don't mean to min