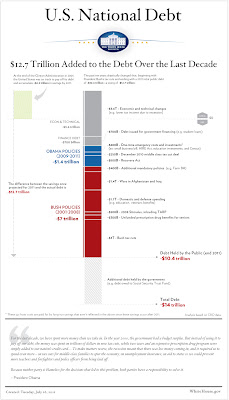
US debt charts of note

On Sunday, July 24, the New York Times ran a chart illustrating the fiscal results of national policy. Given the fierceness of the ongoing debt-ceiling debate, the chart got picked up and disseminated through the web, and with good reason: It's clear, it's straightforward, and it communicates something very important. (By the way, I have it on good authority that this was the first instance of color being used on the NYT editorial page.) You can see the chart here . Now, finally, comes the White House with this graphic : The Atlantic 's James Fallows likes it , but I'm less impressed. First of all, from a political point of view, it's a bit late to release this; the chart could/should have focused the congressional debate and the public discourse weeks ago. Secondly, despite the telltale Tufte-style typefaces and additional detail, it's not as intuitively readable as the Times' version. The timeline, such as it is, runs vertically, while the magni...


